Readers want well-written, authentic content that holds their attention and answers their questions. When they get this kind of content from you:
- Google may rank you higher.
- When you rank higher, visitors trust you more.
- When visitors trust you more, they are more likely to become paying customers.
But with all the different copywriting methods and tools to research, draft, and rate the optimization of your content, how do you know what SEO or copywriting tool is actually telling you the truth?
Do readers like long blogs or short blogs? Big words or small ones? Humor? Just the facts?
I set out to answer that exact question by having my team research thousands of queries across a variety of tools to remove the guesswork, and let data reveal the best performing content on the web and determine exactly what makes it so successful.
Tie this in with our latest study on AI optimization and how to rank in ChatGPT and you might be unstoppable in both SEO ranking and AI results.
Table of Contents
Methodology
The top eight results for 205 queries were gathered, for a total of 1,640 results. These queries fell into the following four categories, including a sample (not all) of the queries per category:
Technical Search Queries
- How to calculate apparent power
- What is a derivative in calculus?
- What is a financial statement?
- Tutorials for Inkscape
- Can gout be cured?
Non-Technical Search Queries
- What is love?
- Gluten-free diet
- Ratatouille recipe
- Latest celebrity news
- Tips for surviving a flood
Silly and Random Searches
- Should I tell my parents I’m adopted?
- How to get out of the friend zone?
- Is it normal to talk to yourself?
- Where to buy a real unicorn?
- Where do missing socks go?
SEO Search Queries
- Good vs. bad backlinks
- Does caching help SEO?
- Anchor text best practices
- Stages of the customer journey
- How to recover from a Google penalty?
Content Rating
After searching these queries, we then analyzed the top 8 responses to each of them using the following metrics:
- Flesch-Kincaid Reading Ease
- Flesch-Kincaid Grade Level
- Gunning Fog Score
- Coleman-Liau Index
- Automated Readability Index
- Number of Sentences
- Number of Words
- Percent of Complex Words
- Average Words per Sentence
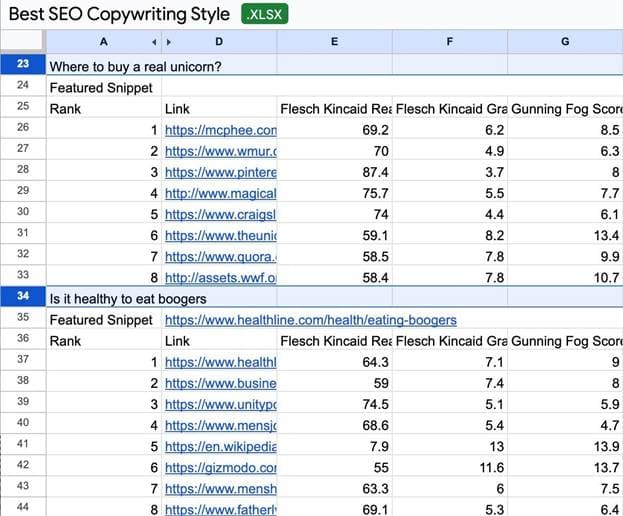
There are two steps to determine the best SEO copywriting practices:
- Find out the average of each factor in the top 8 results of Google
- A “page” on Google is generally considered 10 results per page. Many of the pages include non-text results, like Images, Videos, etc. To account for those two potential result types diluting averages, we focused on weighing 8 results per page.
- Determine the best readability scale to use by calculating their Population Correlation Coefficient.
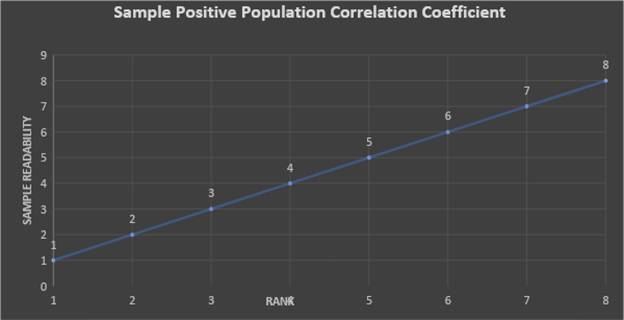
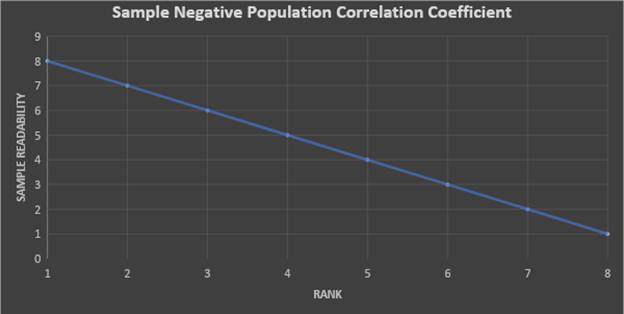
- Population Correlation Coefficient is a value that ranges from -1 to 1. It shows how much a value is related to another. A negative value means that Y decreases as X increases, while a positive value means that Y increases as X increases. Refer to the charts below for illustrations.
- In our case, Y corresponds to readability while X corresponds to rank.
- Positive Correlation = higher readability and higher rank number
- Negative Correlation = lower readability and higher rank number
- We are looking for a factor/readability scale with a negative correlation (i.e., high readability is related to a higher rank)
NOTE
- A population correlation coefficient that is less than 0.3 is usually considered insignificant. However, there are so many SEO factors that even a normally insignificant coefficient can suggest a relationship.
- These coefficients only represent the top 8 results. The overall coefficient may change for results beyond rank 8.
A correlation does not necessarily mean that the change in Y causes the change in X. In our case, the change in readability does not cause the change in rank. Instead, the correlation suggests that there is a third factor that affects both rank and readability, but finding out that third factor is beyond the scope of this study.
Data Analysis
The following analysis shows:
- An average score for each of the 9 metrics across each of the four categories (technical, non-technical, silly/random, SEO). We have also included an overall score (averaging scores from the four categories).
- An interpretation of the data, revealing how strongly each of the 9 metrics correlates with high search results ranking (as determined by calculating its Population Correlation Coefficient).
Data for Flesch-Kincaid Readability Scale
| Category | Average |
|---|---|
| OVERALL | 63.67920732 |
| Technical | 58.00442708 |
| Non-Technical | 62.94714286 |
| Silly and Random | 67.39311224 |
| SEO | 65.26866438 |
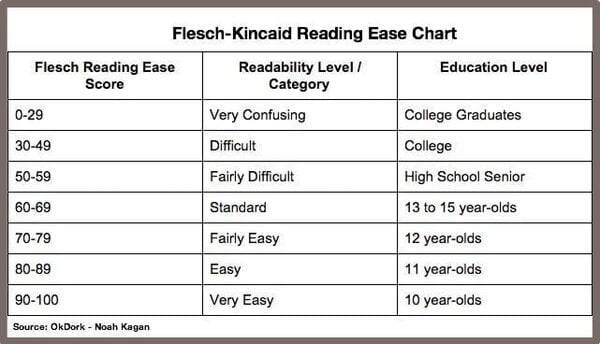
- The average Flesch-Kincaid Rating of all categories is 63.67920732. In the Flesch-Kincaid Scale, 63.67920732 is considered to be readable by 8th—9th graders. Since the average of each category falls on the 8th-9th grade mark, we can hypothesize that the 8th-9th grade readability level is the safe spot for SEO optimization.
- Results for Technical categories have an average rating of 58.00442708. It is significantly lower compared to the average value but still falls under the 8th-9th grade classification.
- Results for the Silly and Random queries have an average rating of 67.39311224, which is significantly higher than the average value but still falls under the 8th-9th grade classification.
- Results for SEO queries have an average rating of 65.26866438, which is significantly higher compared to the average value but still falls under the 8th-9th grade classification.
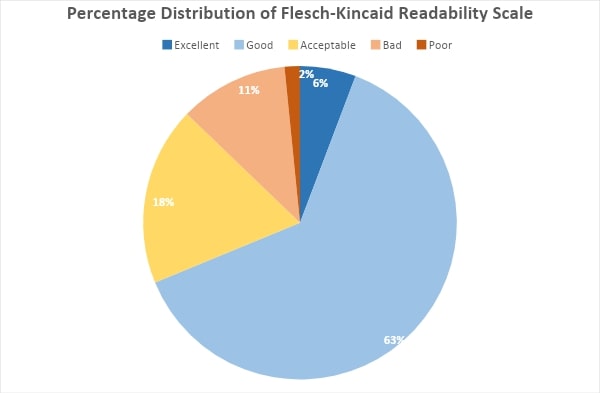
- The majority of the results have good remarks (>60, <=80) followed by those with acceptable remarks (>50, <=60).
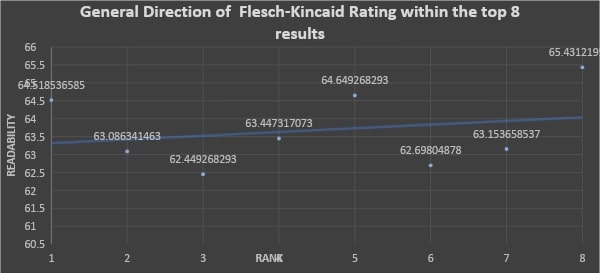
- The population correlation coefficient is 0.2385, suggesting a weak positive correlation. Thus, the correlation suggests that the Flesch-Kincaid Readability Scale is not a reliable scale to use for SEO optimization.
Interpretation of Flesch-Kincaid Readability Data
If you want to stick to a single readability scale, Flesch-Kincaid appears the poorest choice. Its weak positive correlation suggests that the higher your Flesch-Kincaid Readability is, the higher the chance of ranking towards the bottom of the top 8. However, that 0.2385 is a weak correlation, so the impact will not be that great.
If you do use Flesch-Kincaid Readability, consider aiming to at least fall on the 60-80 range because 63% of the top 8 results fall on that mark.
The average for SEO content is 65.26866438, which is significantly higher compared to the average value. It is a good idea to use this value as a minimum.
One possible reason for the high Flesch-Kincaid readability value for SEO is because of its popularity in the SEO industry. FKR is so popular that it is even measured by common SEO tools and plug-ins like Yoast. Hence, SEO writers tend to use FKR as a measure of readability.
| REMARK | MIN | MAX |
|---|---|---|
| EXCELLENT | 80 | ~ |
| GOOD | 60 | 80 |
| ACCEPTABLE | 50 | 60 |
| BAD | 30 | 50 |
| POOR | ~ | 30 |
Data for Flesch-Kincaid Grade Level
| Category | Average |
|---|---|
| OVERALL | 6.783170732 |
| Technical | 7.650520833 |
| Non-Technical | 6.905714286 |
| Silly and Random | 6.32372449 |
| SEO | 6.4625 |
- The average Flesch-Kincaid Grade Level of all categories is 6.783170732, which is readable by 7th graders. Since the average of each category falls on the 7th-8th grade mark, we can hypothesize that the 8th-9th grade readability level is the safe spot for SEO optimization.
- Results for Technical categories have an average rating of 7.650520833. It is significantly lower compared to the average value and is readable by 8th graders.
- Results for SEO categories have an average rating of 6.4625. It is significantly lower compared to the average value and is readable by 6th graders.
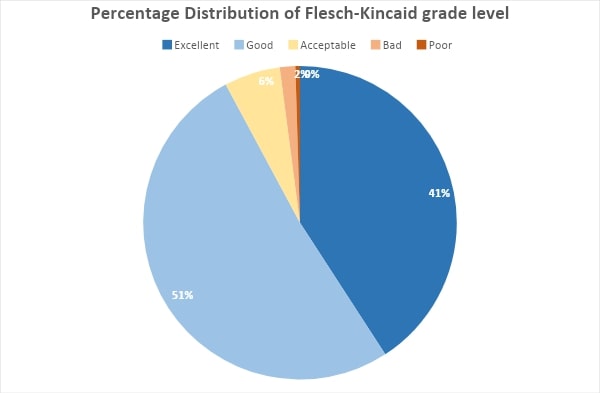
- The majority of the results have good remarks followed by those with an excellent remark.
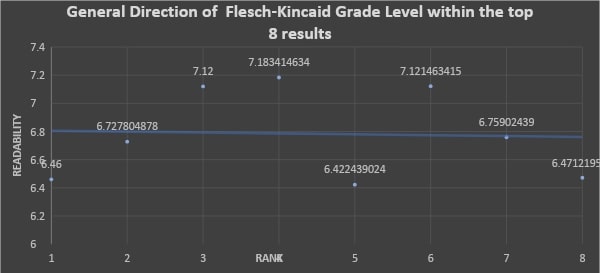
- The population correlation coefficient is -0.047, suggesting the lack of correlation between the Flesch-Kincaid grade level and the rank. Hence, Flesch-Kincaid Grade Level is not the best tool for SEO optimization.
Interpretation of Flesch-Kincaid Grade Level Data
Flesch-Kincaid Grade Level indicates the grade level that a person would need to be at in order to read and understand your content. For instance, a Flesch-Kincaid Grade Level of 6 means that the content can be understood by someone who has completed grade 6 and above. In a nutshell, a higher Flesch-Kincaid Grade means less readability.
Flesch-Kincaid Grade Level is better to use than Flesch-Kincaid Readability because FKGL has a stable correlation. However, it is still not the best readability scale to use because -0.047 is a negligible correlation coefficient, even by the standards of this study.
If you use Flesch-Kincaid Grade Level, aim for at least 6.8, as per the average value. However, Technical topics are more forgiving in terms of Flesch-Kincaid Grade Level. With tech writing, you can aim for a 7.65 (considerably easier to achieve than the 6.8 when it comes to technical writing).
| REMARK | MIN | MAX |
|---|---|---|
| EXCELLENT | ~ | 6 |
| GOOD | 6 | 10 |
| ACCEPTABLE | 10 | 13 |
| BAD | 13 | 17 |
| POOR | 17 | ~ |
Data for Gunning Fog Score
| Category | Average |
|---|---|
| OVERALL | 7.835841463 |
| Technical | 8.64609375 |
| Non-Technical | 7.670714286 |
| Silly and Random | 7.19872449 |
| SEO | 7.80989726 |
- The average Gunning Fog score is 7.835841463, which is readable by 8th graders. Since the average of each category falls on the 7th-8th grade mark, we can hypothesize that the 8th-9th grade readability level is the safe spot for SEO optimization.
- The average Gunning Fog score of results for Technical categories is 8.64609375. It is significantly higher compared to the average value.
- The average Gunning Fog score of results for Silly and Random categories is 7.19872449. It is significantly lower compared to the average value.
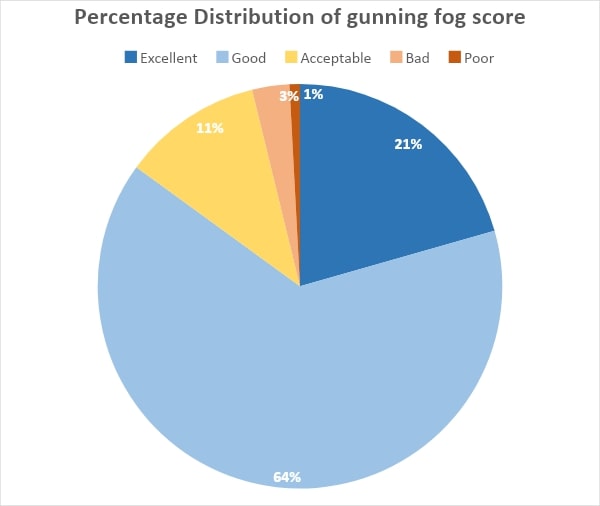
- The majority of the results have good Gunning Fog score remarks (64%), followed by excellent remarks (21%).
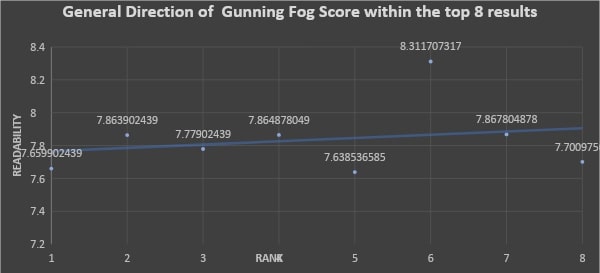
- The population correlation coefficient is 0.228812. However, we will multiply the coefficient by -1 because a higher Gunning Fog Score corresponds to lower readability. Hence, the population correlation coefficient becomes -0.228812, suggesting a weak negative correlation.
Interpretation of Gunning Fog score
The negative correlation coefficient suggests that the better the Gunning Fog Score, the higher your content will rank if it is in the Top 8. Hence, the Gunning Fog score is a great measurement for SEO purposes.
If you optimize for the Gunning Fog Score, you should aim for a score of at least 7.835 and focus on the number of words per sentence and the ratio of complex words to total words. Complex words are words with more than 3 syllables.
| REMARK | MIN | MAX |
|---|---|---|
| EXCELLENT | ~ | 6 |
| GOOD | 6 | 10 |
| ACCEPTABLE | 10 | 13 |
| BAD | 13 | 17 |
| POOR | 17 | ~ |
Data for Coleman Liau Index
| Category | Average |
|---|---|
| OVERALL | 11.6497561 |
| Technical | 12.26708333 |
| Non-Technical | 12.11428571 |
| Silly and Random | 11.10586735 |
| SEO | 12.20188356 |
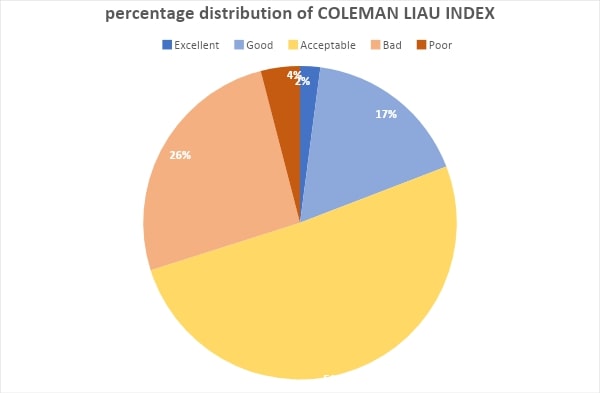
- The majority of the results of the Coleman Liau Index have acceptable readability (readable by 10th to 12th grade). It is followed by results with poor readability (readable by college-level students).
- The average Coleman Liau Index rating of the top 8 results is 11.6497561, which is readable by 10th to 12th grade.
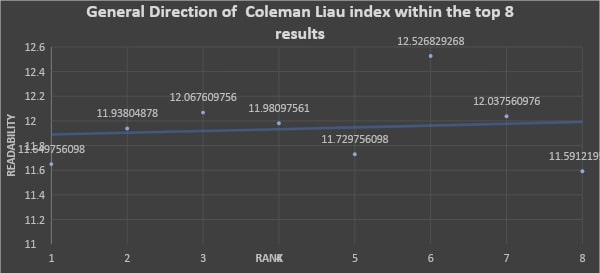
- The correlation coefficient is 0.118788722, suggesting a negligible positive correlation. Both SEO and Non-technical queries have poor readability.
Interpretation of Coleman Liau Index
The negligible correlation suggests that there is little to no correlation between the Coleman Liau index and the rank. So, it may not be a great scale for SEO writing.
If you want to use the Coleman Liau Index for optimization, consider aiming for at least 11.6497561, which is readable by 10th to 12th grade. Aim to lower your average number of sentences per 100 sentences for a better Coleman Liau Index.
| REMARK | MIN | MAX |
|---|---|---|
| EXCELLENT | ~ | 6 |
| GOOD | 6 | 10 |
| ACCEPTABLE | 10 | 13 |
| BAD | 13 | 17 |
| POOR | 17 | ~ |
Data for Automated Readability Index
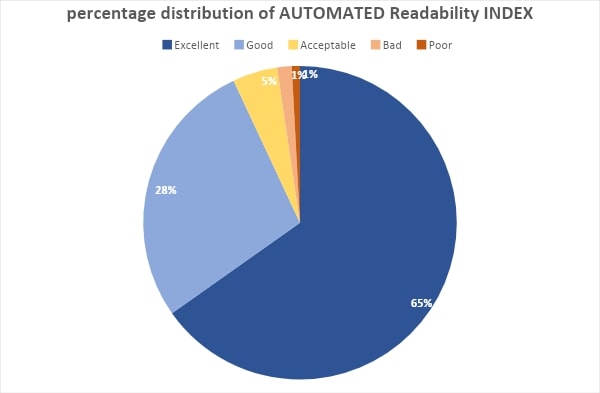
- The majority of the results are either in the excellent or good remark categories.
- Technical topics have a significantly higher average readability compared to the overall average.
- Silly and Random topics have a significantly lower average value compared to the overall value.
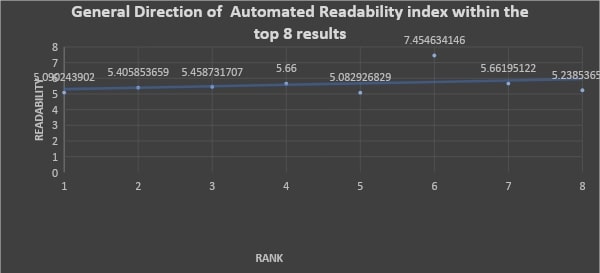
- The population correlation coefficient is 0.292558. However, we will multiply the coefficient by -1 because the higher Automated Readability Index corresponds to lower readability. Hence, the population correlation coefficient becomes -0.292558, suggesting a weak negative correlation.
Interpretation of Automated Readability Index Data
The weak negative correlation, which is almost 0.3, suggests that we can use the Automated Readability Index for optimizing the readability of our content. It suggests that there is a common factor that affects both the Automated Readability Index and rank, so aiming for a good high Automated Readability Index is a reasonable strategy.
The majority of the top 8 results have either excellent and good readability, so aim for those marks. Ideally, your rating should be no more than 6, unless you are writing for a Technical topic.
For a better Automated Readability Index rating, consider aiming for a lower words-to-sentence and characters-to-words ratio.
| Category | Average |
|---|---|
| OVERALL | 5.631609756 |
| Technical | 6.415989583 |
| Non-Technical | 5.801428571 |
| Silly and Random | 4.688010204 |
| SEO | 5.667808219 |
| REMARK | MIN | MAX |
|---|---|---|
| EXCELLENT | ~ | 6 |
| GOOD | 6 | 10 |
| ACCEPTABLE | 10 | 13 |
| BAD | 13 | 17 |
| POOR | 17 | ~ |
Data for Number of Sentences
- The average number of sentences for SEO content is 258.627911, which is significantly higher compared to the overall average.
- The average number of sentences for Silly and Random queries is 205.3545918, which is significantly lower compared to the average overall value.
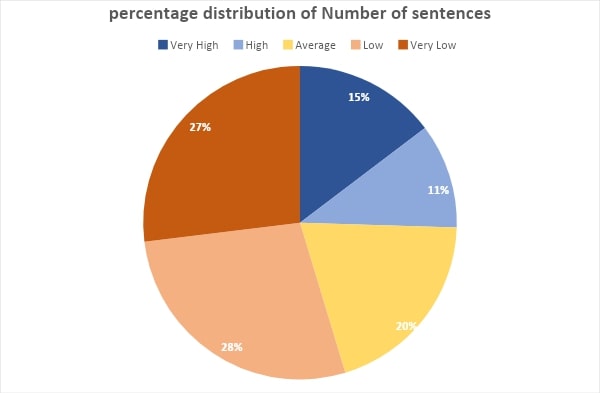
- The majority of the results in the top 8 results have 0-200 sentences.
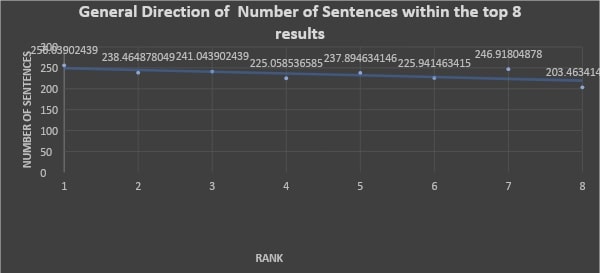
- The population correlation coefficient is -0.64898, suggesting a significant negative correlation.
Interpretation of Number of Sentences Data
-0.64898 is a significant correlation coefficient that suggests a relationship between the number of sentences and rank. The coefficient suggests that longer content tends to rank higher. It is also possible that there is a direct link between the rank and the number of sentences.
The average number of sentences for SEO categories is 258.627911, suggesting that long-form articles are still popular in the SEO industry.
| Category | Average |
|---|---|
| OVERALL | 234.3529878 |
| Technical | 230.6934896 |
| Non-Technical | 229.3389286 |
| Silly and Random | 205.3545918 |
| SEO | 258.627911 |
| REMARK | MIN | MAX |
|---|---|---|
| VERY HIGH | 400 | ~ |
| HIGH | 300 | 400 |
| AVERAGE | 200 | 300 |
| LOW | 100 | 200 |
| VERY LOW | ~ | 100 |
Data for Number of Words
| Category | Average |
|---|---|
| OVERALL | 1911.5811 |
| Technical | 1768.1745 |
| Non-Technical | 1852.0214 |
| Silly and Random | 1520.3648 |
| SEO | 2297.0291 |
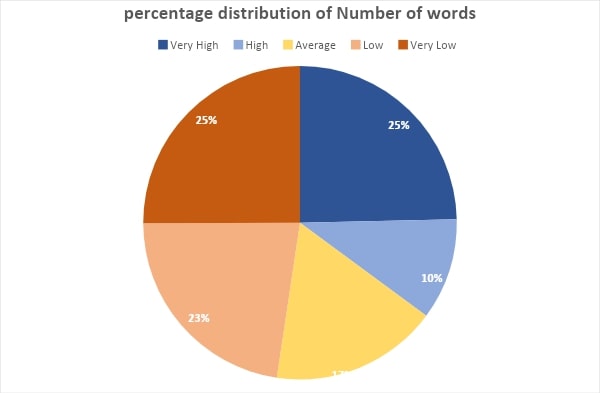
- The average number of words for SEO content is 2297.0291, which is significantly higher compared to the overall average.
- The average number of words for Silly and Random content is 1520.3648, which is significantly lower compared to the overall average.
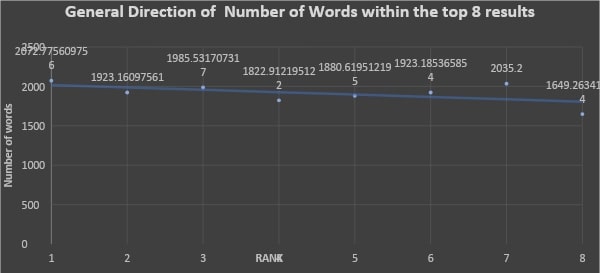
- The -0.553714447 correlation coefficient suggests a significant correlation coefficient.
Interpretation of Number of Words Data
The significant negative correlation shows that the higher the number of words, the higher the chances of ranking high within the top 8. Hence, it is a good idea to utilize long-form content. Try to aim for at least 1911 words, or 2297 when you are writing about an SEO topic.
The -0.553714447 coefficient is a very significant coefficient, especially for our standards for this study. It suggests that there is a possible direct link between rank and the number of words. It can also mean that the number of words is an actual ranking factor.
| REMARK | MIN | MAX |
|---|---|---|
| VERY HIGH | 2900 | ~ |
| HIGH | 2300 | 2900 |
| AVERAGE | 1700 | 2300 |
| LOW | 500 | 1100 |
| VERY LOW | ~ | 500 |
Data for Percent of Complex Words
NOTE
- Complex words are words with 3 or more syllables (polysyllables)
- This set of data is in decimal form. E.g…153645183 is 15.36%
| Category | Average |
|---|---|
| OVERALL | 0.153645183 |
| Technical | 0.16943776 |
| Non-Technical | 0.140047857 |
| Silly and Random | 0.176653827 |
| SEO | 0.13433613 |
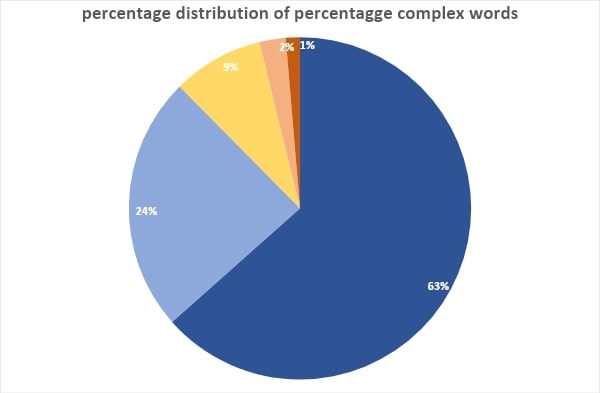
- The majority of the content has either a low or very low percent of complex words.
- Both Technical and Silly and Random results have significantly higher values compared to the overall percentage of complex words.
- SEO results have a significantly lower value compared to the overall average.
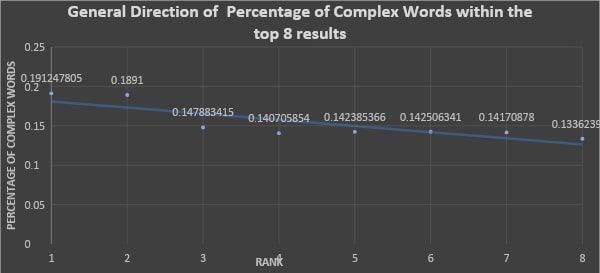
- -0.43877 correlation coefficient suggests that there is a good negative correlation between the rank and the percentage of complex words.
Interpretation of Data for Percentage Complex Words
Unexpectedly, the negative correlation coefficient suggests that a higher percentage of complex words is related to ranking higher within the top 8. This finding is contrary to the tradition of utilizing simple words. To be on the safe side, consider sticking to 15-20% complex words. This range is higher than the overall percentage of complex words but less than the highest average within the top 8, which is the top 1 result (20%).
The negative coefficient tells us three possible things:
- There is a common factor that affects the frequency of complex words and rank.
- There is a small possibility that the frequency of complex words is a direct ranking factor.
- The negative correlation to avoiding polysyllables suggests that polysyllabic words will not drag your rank down.
Don’t sweat too much about simplifying words if it will reduce the substance of your content.
Instead of focusing on the complexity, focus on the familiarity of a word. This is especially true because search engines likely employ information retrieval algorithms like TF-IDF to dynamically identify synonyms and relevance.
We have no idea how Google dynamically identifies synonyms, but you can play safe by using commonly used words so that Google will get the exact context of your content. Because familiar words will occur more often on the web, machine learning algorithms will have more basis to learn the context of familiar words. Hence, it’s easier for search engines to understand the context and definition of such words.
Note that there are short words with simpler and more familiar polysyllabic synonyms (e.g., extol is synonymous with glorify). Short word length doesn’t necessarily indicate familiarity.
| REMARK | MIN | MAX |
|---|---|---|
| VERY LOW | ~ | 0.15 |
| LOW | 0.15 | 0.2 |
| AVERAGE | 0.2 | 0.25 |
| HIGH | 0.25 | 0.3 |
| VERY HIGH | 0.3 | ~ |
Data for Average Words per Sentence
| Category | Average |
|---|---|
| OVERALL | 9.319048171 |
| Technical | 9.264789063 |
| Non-Technical | 9.755214286 |
| Silly and Random | 9.105790816 |
| SEO | 9.28875 |
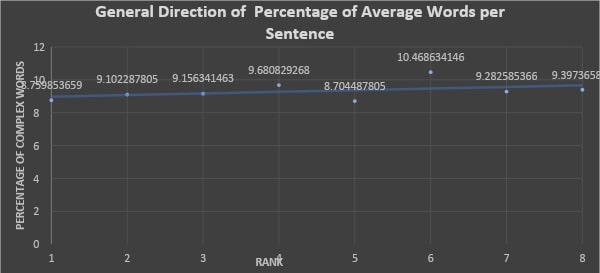
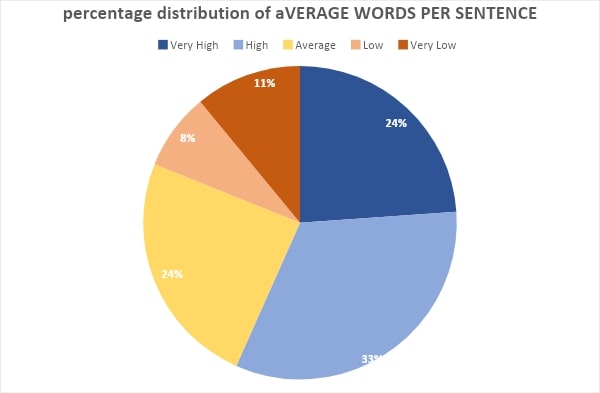
- There is no significant difference between the overall average and any of the specific categories.
- The population correlation coefficient is 0.43069261, which can be considered as a significant positive correlation.
Interpretation of Data for Words per Sentence
The correlation coefficient of 0.430693 suggests that there is a link between the number of words per sentence and the rank. It suggests that the higher the words per sentence, the lower you will rank within the top 8 results. This correlation suggests three possible things:
- There is a small possibility that the number of words per sentence is directly tied to the rank.
- There is a common factor that affects both words per sentence and ranking.
- It is a good idea to make sentences as concise as possible.
| REMARK | MIN | MAX |
|---|---|---|
| VERY HIGH | ~ | 6 |
| HIGH | 6 | 9 |
| AVERAGE | 9 | 12 |
| LOW | 12 | 15 |
| VERY LOW | 15 | ~ |
Conclusion of Best SEO Copywriting Ranking Strategies
If you are planning to use a readability scale to help optimize your content, the Gunning Fog Score or Automated Readability Index appear to be the most beneficial.
Scoring a -0.228812 and -0.292558 correlation coefficient respectively, this suggests that having a better rating on these indexes improves the chances of ranking higher within the top 8.
The Gunning Fog Score formula involves the word-to-sentence ratio and the ratio of the polysyllabic to simple words. Since the set of data for complex word percentage suggests that complex words won’t hurt your ranking, a primary focus on the word-to-sentence ratio may support higher rankings.
The Automated Readability Index formula involves the character-to-words ratio and words-to-sentences ratio. Hence, you should improve your rating on both criteria for a greater Automated Readability Index score.
The most significant factor that showed correlation with the ranking is the number of sentences, with a correlation of -0.64898. It is followed by the number of words with a correlation coefficient of -0.553714447. The third place goes to -0.43877 for the percentage of complex words.
The population correlation coefficient of the number of words per sentence is 0.43069261 and is also notable.
Tips to Write Higher Ranking Content?
The results suggest that utilizing long-form content is a reliable SEO strategy. However, you should take note of the following considerations when writing long-form content.
More Sentences, Fewer Words
- The data suggests that the number of sentences has a higher correlation to rank than the number of words does. Hence, each sentence should be as short and concise as possible. For additional evidence, take a look at the positive correlation between the words per sentence and rank (more words per sentence = lower rank).It is also worth noting that the top-scoring readability scales for this study both use the words-to-sentence ratio for calculations.
- One hypothesis to explain this is that it is easier for machine learning algorithms to understand the context of short sentences.
Familiar Over Short Words
- The data suggests that polysyllables will not harm your rank. The increase in the number of polysyllables is even associated with ranking higher. Hence, you should aim for utilizing familiar words instead of short words.
- Note: Refer to the section on the Interpretation of Data for Percentage Complex Words for a recap of the hypotheses regarding this association.
Other Observations
- SEO content is notably optimized for Flesch-Kincaid Reading Ease.
- This content also has the highest averages in terms of content length but the lowest in terms of percentage of complex words.
- The technical category tends to be more forgiving in terms of readability.
- Silly queries have higher readability ratings compared to others.
TL;DR
Key Takeaways
- Best Copywriting Approac:
- The Gunning Fog Score or Automated Readability Index appear to be the most beneficial to model copywriting after.
- Word Count
- Successful content averages 1,700 – 2,300 words.
- This suggests the importance of comprehensive material that thoroughly addresses user needs without being overly verbose.
- Sentence Length
- The average words per sentence of ranking content is 9.3 words.
- This maintains reader engagement and supports ease of understanding.
- Keyword Integration
- Natural and strategic placement of keywords is critical.
- Overstuffing or neglecting keywords can harm rankings.
- Vocabulary Complexity
- A lower proportion of complex words correlates with better rankings.
- Simple, direct language resonates more effectively with search engines and readers alike.
References
Readability Formulae
Automated readability index

Coleman-Liau Index

Gunning Fog Score

Flesch-Kincaid Reading Ease

Flesch-Kincaid Grade Level

Disclaimer
Because it took months to research and analyze, some major algorithm updates have been released since and may change results. While this data implies that certain values lead to better content performance (e.g., content with at least 2200 words—the average SEO content length according to our research), no specific recommendations are being made, are to be tested at your own risk, and there are no guarantees for success.
